Effective Ways to Find Cumulative Frequency in 2025: Improve Your Data Analysis Skills!
Cumulative Frequency: Effective Ways to Find Cumulative Frequency in 2025
Cumulative frequency is a crucial statistical concept that helps you understand data distributions better. Whether conducting research, analyzing survey results, or working with data sets, knowing how to **find cumulative frequency** allows you to visualize and interpret numerical data more effectively. This article highlights various methods and techniques to calculate cumulative frequency, the significance of cumulative frequency in statistics, and how you can apply it in real-life scenarios.
Understanding Cumulative Frequency
To effectively analyze data, it’s essential to start with a thorough understanding of **cumulative frequency**. In its simplest form, cumulative frequency refers to the running total of frequencies in a data set. As you progress through the data, you add the frequency of each category to the sum of the previous frequencies. The ultimate goal is to identify the number of observations that fall within and beyond a certain value. This process helps in visualizing cumulative frequencies and recognizing data trends.
Cumulative Frequency Definition
The **cumulative frequency definition** can be summarized as the total of all frequencies up to a certain point in a dataset. For instance, if a dataset has values from 1 to 10, the cumulative frequency for the value 5 would include all occurrences of 1 to 5 in the dataset. This concept is particularly useful in statistics as it aids in identifying how much data is below a particular threshold, enabling one to understand data distributions much clearer.
Cumulative Frequency for Grouped Data
When dealing with large datasets, you may need to determine the **cumulative frequency for grouped data**. This approach involves creating a cumulative frequency table that groups data points into categories. You would list each category, its frequency, and then calculate the cumulative frequency for each category. Grouping helps in simplifying the analysis while still offering insight into the distribution of data points.
Importance of Cumulative Frequency
The **importance of cumulative frequency** lies in its ability to reveal trends and patterns in datasets. It is often utilized in various fields such as economics, education, and the social sciences to depict how data accumulates over ranges or time. By using cumulative frequency, statisticians can generate cumulative frequency distribution graphs, which highlight how frequently data points occur and assist in making informed decisions based on data patterns.
Cumulative Frequency Calculation Methods
There are several methods to **calculate cumulative frequency**, each serving different purposes depending on the complexity of the dataset. Below, we explore some effective techniques for calculating cumulative frequency that you can apply in your data analysis.
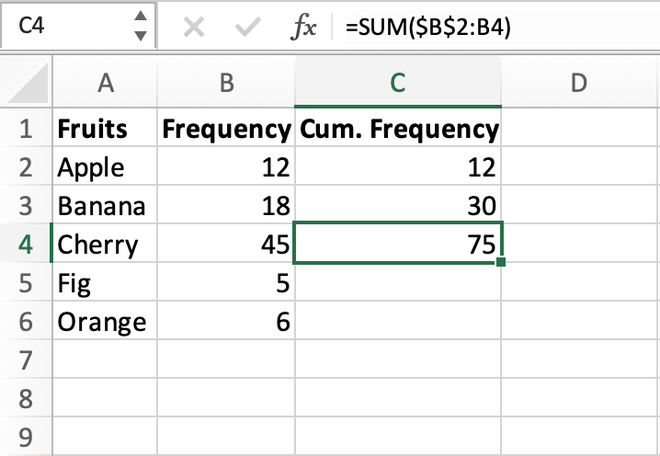
Constructing a Cumulative Frequency Table
Creating a **cumulative frequency table** is a fundamental step in data analysis. Begin by selecting a dataset and organizing it into a frequency distribution table. Once you have your frequencies outlined, perform the cumulative frequency calculation by progressively adding the frequency of each class interval to the frequencies that precede it. For instance:
- Age Group (0-10): Frequency = 3
- Age Group (11-20): Frequency = 5; Cumulative Frequency = 3 + 5 = 8
- Age Group (21-30): Frequency = 7; Cumulative Frequency = 8 + 7 = 15
- Age Group (31-40): Frequency = 4; Cumulative Frequency = 15 + 4 = 19
Thus, the cumulative frequency table provides an excellent pattern recognition tool, allowing for clearer insights into the dataset.
Cumulative Frequency Chart and Graphs
Once you’ve constructed your cumulative frequency table, you can visualize the data using a **cumulative frequency graph**. A simple way to depict cumulative frequency is through a line graph plotting cumulative frequency values against their respective categories. This visual representation will help you identify emerging patterns and shifts in the data distribution, making it an invaluable component of any analysis.
Applying the Cumulative Frequency Formula
The **cumulative frequency formula** can be described as follows: for any class interval, the cumulative frequency is the sum of the existing frequency plus all preceding frequencies. The formula allows you to calculate cumulative frequency systematically and ensures accuracy in analysis. For example, if you have a frequency of 10 for the interval label and the cumulative frequency before it is 25, the cumulative frequency for this interval will simply be 10 + 25 = 35.
Cumulative Frequency in Practical Applications
Utilizing cumulative frequency goes beyond mere academic study; it has real-world applications. From research breakthroughs to essential business insights, cumulative frequency aids industries in understanding the statistical behavior of their data. Here are several practical applications of cumulative frequency.
Cumulative Frequency in Research
In research, understanding data is crucial, and **cumulative frequency** can lead to significant discoveries. For instance, in social studies, researchers collect data on respondent ages to determine correlations between ages and opinions on topics such as public health. By calculating cumulative frequency based on this age data, researchers can see the number of individuals that align with different opinions within specific age ranges.
Cumulative Frequency in Surveys
Surveys are another area where calculating cumulative frequency proves invaluable. When conducting a survey, analysts can break down responses into categories and compute how many total responses fall into each category. This usage helps organizations adjust their strategies based on cumulative response insights. For example, in customer satisfaction surveys, a company can see how many customers rated their service above a satisfactory level, thus adjusting areas for improvement based on cumulative findings.
Cumulative Frequency in Bar Charts
Cumulative frequency is graphical analysis as well and can be particularly effective when depicted in a **cumulative frequency bar chart**. You can illustrate the cumulative frequency of each category using a bar chart, giving a quick visual reference that helps in identifying the total responses per category at a glance. This method also works well in presenting data during presentations or organizational meetings, as it communicates essential insights rapidly.
Key Takeaways
- Understanding cumulative frequency is integral to effective data analysis.
- Cumulative frequency can be calculated using tables, charts, and the cumulative frequency formula.
- Various applications of cumulative frequency are prevalent in research and survey analysis.
- Graphical representations like charts and graphs enhance understanding of cumulative data.
- Mastering cumulative frequency can significantly improve your data analysis skills, making you more effective in your field.
FAQ
1. How do I construct a cumulative frequency table?
To construct a **cumulative frequency table**, first organize your data into a frequency distribution table. Next, calculate the cumulative frequency by adding each corresponding frequency to the cumulative total of the preceding frequencies. Ensure clear labeling of each category for easier comprehension.
2. What is the difference between cumulative frequency and relative frequency?
**Cumulative frequency** sums up the total number of observations below a particular value, while **relative frequency** represents the proportion of the total count for a specific category relative to the entire dataset. In essence, relative frequency is a fraction, whereas cumulative frequency aggregates data.
3. Can cumulative frequency be applied to grouped data?
Yes, **cumulative frequency can be applied to grouped data**. When working with larger datasets, it’s important to group data into class intervals. You can easily calculate cumulative frequency for these intervals to analyze the distribution effectively.
4. How is cumulative frequency represented visually?
Cumulative frequency can be visually represented through **cumulative frequency graphs**, where frequencies along the y-axis and data categories along the x-axis create an informative line chart. This visualization helps in easily identifying trends and data distributions.
5. Why is understanding cumulative frequency important?
Understanding **cumulative frequency is important** because it aids in interpreting data distributions. By grasping cumulative trends, researchers can derive meaningful insights about the behavior of their data sets, leading to conclusions that impact decision-making processes in various fields.
6. What are some tools for calculating cumulative frequency?
There are numerous tools available, including spreadsheet software like Microsoft Excel or Google Sheets, which facilitate the calculation of **cumulative frequency** easily. These tools allow for the computation and graphical representation of cumulative frequency distributions quickly and effectively.
7. Are there any practical examples of cumulative frequency applications?
Indeed, practical examples include analyzing survey response distributions, measuring student grade performances, or determining revenue accumulation patterns in businesses. Real-world calculations and visual representations of **cumulative frequency** make them decisive in effective decision-making.
For more resources on cumulative frequency, be sure to check out our articles: here and here!

